

碳排放量增加引发的全球气候变化已受到各界的广泛关注,碳达峰、碳中和等目标的实施是促进绿色低碳可持续发展的重要举措。土地是生态系统碳循环过程中碳排放的重要来源,对维持碳平衡起关键作用,利用科学的土地规划管理策略以有效控制碳排放是当前研究的重点,了解土地利用格局,进行碳平衡分区研究,因地制宜提出不同区域碳减排策略,对碳减排的实施具有重要推动作用。相关学者从不同角度开展了土地利用碳排放研究,肖磊等[1]、Heil等[2]基于碳排放系数法,测算不同用地类型碳排放及碳吸收量,并结合ArcGIS软件进行时空分析。相关学者[3-4]基于对数平均迪氏指数分解法(LMDI)、地理加权回归(GWR)等模型,分析了能源消费、地区生产总值、人口规模、土地开发度等指标对土地利用碳排放量的影响。运用碳排放系数法、马尔可夫模型及灰色预测模型等,借助IDRISI软件可对碳排放特征进行分析及预测[5-6]。利用基尼系数、经济贡献系数及生态承载系数可对研究区域进行分区[7-9]。
土地利用碳平衡分区研究有助于研究区域制订有针对性的减排策略,实现土地利用绿色低碳发展。本文以黑龙江省为研究区,依据碳排放基尼系数、碳排放风险、碳排放强度、经济贡献系数和生态承载系数等指标,对该地区进行分区,包括低碳优化区、碳总量控制区及碳汇功能区,并提出不同碳平衡区域的减排优化策略,探寻实现低碳土地利用的有效途径,为实现“双碳”减排目标提供参考。
1 材料与方法
1.1 研究区基本情况
研究区位于43 °26'—53 °33' N,121 °11'—135 °05' E。辖13个市(A~N);是重点林区之一,森林面积、森林总蓄积量和木材生产量均较高,森林面积2 150.6万hm2,森林覆盖率47.3%,森林蓄积量22.38亿m3 。
1.2 数据来源
本研究土地利用数据来源于中国科学院资源环境科学数据中心(http://www.resdc.cn/),该数据以Landsat-TM图像为信息来源,通过人工目视解译生成,空间分辨率为1 km。研究区土地利用碳排放量及各地市土地利用碳排放量来源于相关研究成果[10],具体数据见表1~2。社会经济数据来源于《中国统计年鉴》《黑龙江省统计年鉴》及各市统计年鉴中的地区生产总值,主要用于计算研究区及各地市土地利用碳排放强度、经济贡献系数及生态承载系数。
表1 1980—2023年研究区土地利用碳排放量单位:×104 t |
| 年份 | 总碳排放 | 总碳吸收 | 净碳排放 | |
|---|---|---|---|---|
| 1980 | 4 283.94 | 1 275.06 | 3 008.89 | |
| 1990 | 5 856.15 | 1 264.39 | 4 591.76 | |
| 1995 | 6 937.27 | 1 239.27 | 5 698.00 | |
| 2000 | 6 690.42 | 1 214.75 | 5 475.67 | |
| 1980—2000年的变化量 | 2 406.48 | -60.31 | 2 466.78 | |
| 2005 | 9 397.33 | 1 212.85 | 8 184.48 | |
| 2010 | 12 514.65 | 1 210.68 | 11 303.97 | |
| 2015 | 13 454.19 | 1 205.65 | 12 248.54 | |
| 2020 | 14 396.33 | 1 121.91 | 13 274.42 | |
| 2023 | 15 060.01 | 1 127.21 | 13 919.79 | |
| 2005—2023年的变化量 | 10 776.06 | -147.85 | 10 910.90 |
表2 2000—2023年研究区各地市土地利用碳排放量 (×104 t) |
| 年份 | A区 | B区 | C区 | D区 | E区 | F区 | G区 | I区 | J区 | K区 | L区 | M区 | N区 |
|---|---|---|---|---|---|---|---|---|---|---|---|---|---|
| 2000 | 612.62 | 648.82 | 425.90 | 340.58 | 162.30 | 1 449.85 | 4.76 | 195.70 | 441.48 | 151.82 | -80.54 | 199.63 | -294.59 |
| 2010 | 1 224.58 | 1 087.01 | 786.01 | 555.12 | 743.46 | 2 414.27 | 146.43 | 351.75 | 867.99 | 399.81 | -5.09 | 323.26 | -290.15 |
| 2020 | 1 421.37 | 885.96 | 541.93 | 635.95 | 786.03 | 3 628.37 | 483.75 | 416.12 | 925.89 | 227.11 | 60.63 | 622.12 | -244.12 |
| 2023 | 1 501.28 | 799.71 | 581.29 | 703.07 | 835.56 | 4 126.75 | 528.14 | 487.20 | 1 032.88 | 308.05 | 42.41 | 704.93 | -256.47 |
| 2000—2023年的变化量 | 888.66 | 150.89 | 155.39 | 362.49 | 673.26 | 2 676.9 | 523.38 | 291.5 | 591.4 | 156.23 | 122.95 | 505.3 | 38.12 |
1.3 试验方法
1.3.1 碳排放基尼系数
以基尼系数为指标,评估各地区间碳补偿比率的变化情况,较高的碳补偿率表明该地区具有较高的固碳潜力[11]。计算如式(1) 。
式中,Zi 、Zj 为i、j区域的碳补偿率,n为研究区监测点样本数, 为研究区监测点碳补偿率平均值。基尼系数<0.4为相对合理状态,基尼系数>0.6为不协调状态。
1.3.2 碳排放风险
式中,C i 为i区土地利用碳排放量;S为研究区总面积。
1.3.3 碳排放强度
利用碳排放强度表示单位地区生产总值带来的碳排放量。计算如式(3) 。
式中,C为研究区土地利用碳排放量;G为折价后的地区生产总值,碳排放强度越小,表示该区域单位地区生产总值所产生的二氧化碳量越小。根据其强度大小分为4个等级,0~0.50、0.51~1.00、1.01~2.00、2.00以上。
1.3.4 经济贡献系数
利用经济贡献系数(ECC)表示单位地区碳生产力大小。ECC表示某一地区生产总值占全省生产总值的比例与该区域碳排放量占全省比值。计算如式(4) 。
式中,Gi 和G分别表示i区及研究区的生产总值,Ci 和C分别表示i区及研究区的碳排放量。ECC>2时,表明该地区经济贡献比率大于碳排放的比率,说明碳生产力较高;ECC<2,说明碳生产力较弱。
1.3.5 生态承载系数
碳生态承载系数(ESC)表示某一地区碳吸收量占研究区比例与该区域碳排放量占研究区比例的比值,反映了该区域碳汇能力的大小[14]。计算如式(5) 。
式中,CAi 和CA 分别表示i区及研究区的碳吸收量。ESC值越高,表明该地区碳汇能力越强;反之,说明碳汇能力较弱。
1.3.6 碳平衡分区
基于研究区各地区碳排放基尼系数、碳排放强度、经济贡献及生态贡献等指标的计算,参考赵荣钦等[14]的方法,综合考量研究区实际情况、区域碳平衡及绿色发展,对其进行碳平衡划分。
2 结果与分析
2.1 碳排放基尼系数
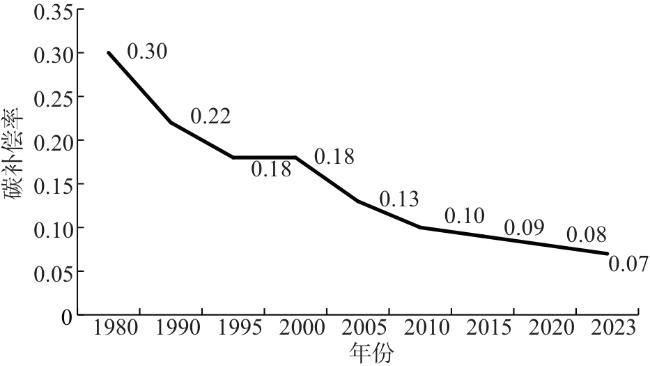
由图1可知,研究区碳补偿率整体处于低位,且随着时间的推移逐年下降,从1980年的0.30下降到2023年的0.07,说明研究区的碳汇总量无法满足碳汇需求。基尼系数计算表明,2000、2010、2022、2023年的基尼系数分别为0.76、0.83、0.85、0.88,均超过0.60,处于不协调状态,说明研究区碳补偿率存在较大的空间分异,并呈现出不断扩大的趋势。总之,研究区在减少碳排放方面应进一步加强管理。
2.2 碳排放风险
参考汤峰等[13]的自然断点法,结合研究区实际情况将碳排放风险划分为4个等级:-6.51~0.11、0.12~12.26、12.27~27.05、27.06以上,分别代表低度风险、中度风险、高度风险和重度风险。
由表3可知,2010—2023年,除B区、C区、K区和L区外,各地市土地利用碳排放风险值均呈不同程度的增加。其中,F区、G区和M区碳排放风险值增速较快,2000—2023年F区碳排放风险值由32.02增加至85.06,始终处于重度风险状态;G区由0.11增加至11.04,由低度风险转变为中度风险,其碳排放风险转变与耕地和建设面积增加以及林地面积下降有关;M区由4.41增加至15.37,由中度风险变为高度风险。G区和M区在2000—2010年增速较慢,在2010—2023年增速较快,预测未来碳排放风险仍有增加趋势。N区和L区的碳排放风险值始终处于较低水平,但风险值逐年升高。A区、D区、E区、I区和J区的碳排放风险值逐年升高,在2000—2010年增速较快,但在2010—2023年增速变缓,预测未来会有降低的趋势。
表3 2000—2023年研究区各地市土地利用碳排放风险值 |
| 年份 | A区 | B区 | C区 | D区 | E区 | F区 | G区 | I区 | J区 | K区 | L区 | M区 | N区 |
|---|---|---|---|---|---|---|---|---|---|---|---|---|---|
| 2000 | 13.53 | 14.33 | 9.41 | 7.52 | 3.59 | 32.02 | 0.11 | 4.32 | 9.75 | 3.35 | -1.78 | 4.41 | -6.51 |
| 2010 | 27.05 | 24.01 | 17.36 | 12.26 | 16.42 | 53.32 | 3.23 | 7.77 | 19.17 | 8.83 | -0.11 | 7.14 | -6.41 |
| 2020 | 31.39 | 19.57 | 11.97 | 14.05 | 17.36 | 80.14 | 10.68 | 9.19 | 20.45 | 5.01 | 1.34 | 13.74 | -5.39 |
| 2023 | 35.20 | 22.17 | 12.73 | 15.38 | 18.19 | 85.06 | 11.04 | 11.22 | 22.14 | 5.15 | 1.04 | 15.37 | -5.11 |
2000年,各地市碳排放风险等级空间差异较不明显,N区、L区及G区为低度风险地区,中度风险地区7个,占比53.85%,B区和A区为高度风险地区,F区为重度风险地区。2010年,空间差异较为明显,F区仍为重度风险地区,中度风险地区由7个降为5个,其中G区由低度风险升为中度风险;高度风险地区由2个升至5个,其中J区、C区和E区由中度风险升为高度风险;低度风险区2个,分别为N区和L区。2020年,各区域空间差异显著,重度风险区2个,分别为F区和A区,其中F区始终为重度风险区;高度风险区5个,高度风险和重度风险区占比53.85%;N区始终为低度风险区,主要是由于该区生态环境较好,林地为主要的用地类型,碳吸收能力强,因此碳排放风险等级低。2023年,各区域空间差异明显,重度风险区2个,分别为F区和A区,其中F区始终为重度风险区;高度风险区7个,高度风险和重度风险地区占比较高;N区始终为低度风险区。总体来看,2000—2023年各地市碳排放风险等级逐年升高,空间差异性逐渐明显。
2.3 碳排放强度
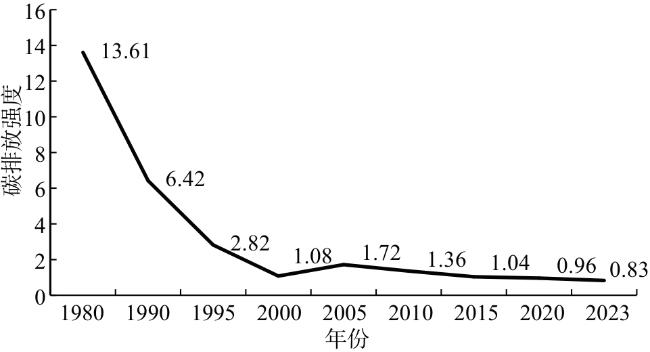
由图2可知,研究区碳排放强度呈逐年下降趋势,其中1980—2000年碳排放强度降速较快,2000—2005年间碳排放强度有所回升,2005年开始平稳下降,之后维持在较低碳排放强度水平。


由表4可知,2000年,研究区各区域大多处于较高的碳排放强度水平,N区、M区和A区碳排放强度在0.50~1.00,其余城市碳排放强度均高于1.00,占比76.92%,其中L区、F区、I区和K区土地利用碳排放强度在1.01~2.00,处于较高水平,而B区、G区、D区、E区、J区及C区土地利用碳排放强度均大于2.00。2010年,大部分地区碳排放强度呈下降趋势,且处于较低水平;N区和A区碳排放强度较低,在0.5以下,而M区、D区和J区碳排放强度较为稳定,仍大于2.00,L区、F区、I区及K区的碳排放强度由1.00~2.00降低到0.50~1.00,B区、G区、E区及C区的碳排放强度由2.00以上降低到1.00~2.00。2020年,各区域碳排放强度进一步降低,其中N区、L区、A区和K区碳排放强度小于0.50,D区碳排放强度在1.00~2.00,而G区碳排放强度有所升高。2023年仅F区发生了变化,碳排放强度降低,其他城市的碳排放级别均未发生变化。
表4 2000—2023年研究区各地市土地利用排放强度 |
| 年份 | A区 | B区 | C区 | D区 | E区 | F区 | G区 | I区 | J区 | K区 | L区 | M区 | N区 |
|---|---|---|---|---|---|---|---|---|---|---|---|---|---|
| 2000 | 0.75 | 2.34 | 3.74 | 5.91 | 2.48 | 1.41 | 2.21 | 1.63 | 8.12 | 1.47 | 1.70 | 0.62 | 0.82 |
| 2010 | 0.37 | 1.25 | 1.97 | 2.35 | 1.99 | 0.83 | 1.49 | 0.77 | 2.89 | 0.72 | 0.79 | 0.52 | 0.41 |
| 2020 | 0.23 | 0.61 | 1.01 | 2.16 | 1.64 | 1.24 | 2.25 | 0.41 | 3.76 | 0.26 | 0.48 | 0.56 | 0.30 |
| 2023 | 0.25 | 0.57 | 1.00 | 2.05 | 1.60 | 0.98 | 2.15 | 0.50 | 3.70 | 0.25 | 0.49 | 0.50 | 0.28 |
总体来看,2000—2023年各区域碳排放强度呈不同程度的降低,其中,L区、B区、K区从碳排放强度较高水平转变为较低水平;N区和A区一直处于较低碳排放强度水平,其中N区生产总值较低,但单位生产总值所带来的碳排放量极低,因此碳排放强度低,而A区碳排放量较高,但其生产总值较高,因此,A区碳排放强度相对较低;G区、D区、J区、E区在研究期内一直处于较高碳排放强度水平。
2.4 经济贡献系数
由表5可知,2000—2023年各区域经济贡献系数处于相对波动的状态。2000年,除N区、M区和A区经济贡献系数在2以上外,其余地区经济贡献系数均小于2,B区、D区、G区、E区、J区及C区经济贡献系数在0~1.00,水平较低;L区、I区、F区和K区的经济贡献系数在1.00~2.00;2010年,B区、G区、A区、K区和M区经济贡献水平有所提高,其中A区经济贡献率提升最快,达到4.00以上;2020年,A区、D区、E区、F区、G区、J区、M区经济贡献水平下降,B区、C区、I区、K区和N区经济水平提高。2023年研究区未发生明显变化。整体来看,N区以及A区在研究期处于较高经济贡献水平,N区生产总值较低,主要依靠较低碳排放量以及较高碳汇量维持较高经济贡献率,A区碳排放量高,但生产总值远高于其他地区,因此能维持较高的经济贡献水平。F区是重要的石油生产和石化工业基地,其虽地区生产总值较高,但由于能源消费带来的碳排放量远高于其他地区,F区经济贡献水平较低。
表5 2000—2023年研究区各地市土地利用经济贡献系数 |
| 年份 | A区 | B区 | C区 | D区 | E区 | F区 | G区 | I区 | J区 | K区 | L区 | M区 | N区 |
|---|---|---|---|---|---|---|---|---|---|---|---|---|---|
| 2000 | 2.84 | 0.76 | 0.81 | 0.62 | 0.90 | 1.23 | 0.89 | 1.30 | 0.52 | 1.98 | 1.65 | 2.04 | 2.55 |
| 2010 | 4.07 | 1.10 | 0.73 | 0.62 | 0.73 | 1.13 | 1.88 | 1.28 | 0.48 | 2.60 | 0.75 | 2.09 | 2.47 |
| 2020 | 3.89 | 1.17 | 0.94 | 0.53 | 0.67 | 0.72 | 0.52 | 1.32 | 0.44 | 2.76 | 1.85 | 2.01 | 2.49 |
| 2023 | 3.80 | 1.25 | 0.96 | 0.63 | 0.65 | 0.77 | 0.60 | 1.29 | 0.47 | 2.77 | 1.82 | 2.05 | 2.46 |
2.5 生态承载系数
由表6可知,研究区生态承载系数呈现北部地区偏高,南部地区偏低的态势。2000年,N区、L区以及G区生态承载系数较高,其余地区均低于5;A区、E区和K区生态承载系数在1.00~5.00;B区、F区、M区、D区、I区、J区和C区生态承载系数在0~1.00。2010年,L区、I区生态承载系数明显上升,E区生态承载系数有所下降,其余地区较为稳定。2020年,L区、G区、I区生态承载系数均下降;K区生态承载系数上升,其余地区较为稳定。2023年,各区域生态承载系数均未发生明显改变。整体来看,2000—2023年,N区处于较高生态承载水平,与其林地资源丰富,碳吸收能力强有关;而B区、F区、M区、D区、I区、E区、J区、C区常年处于低生态承载水平,因此需加强其碳汇能力,控制碳排放量,以提高其生态承载能力。
表6 2000—2023年研究区各地市土地利用生态承载系数 |
| 年份 | A区 | B区 | C区 | D区 | E区 | F区 | G区 | I区 | J区 | K区 | L区 | M区 | N区 |
|---|---|---|---|---|---|---|---|---|---|---|---|---|---|
| 2000 | 2.61 | 0.30 | 0.42 | 0.38 | 3.93 | 0.41 | 5.07 | 0.34 | 0.86 | 1.73 | 5.05 | 0.63 | 6.98 |
| 2010 | 2.33 | 0.23 | 0.67 | 0.21 | 0.88 | 0.83 | 5.72 | 2.69 | 0.84 | 1.52 | 8.02 | 0.44 | 6.92 |
| 2020 | 2.23 | 0.26 | 0.64 | 0.25 | 0.70 | 0.55 | 3.87 | 1.42 | 0.86 | 2.17 | 7.12 | 0.47 | 6.99 |
| 2023 | 2.35 | 0.28 | 0.66 | 0.30 | 0.77 | 0.56 | 3.79 | 1.50 | 0.79 | 2.23 | 7.15 | 0.50 | 6.95 |
2.6 碳平衡分区
结合各区域碳排放基尼系数、碳排放强度、经济贡献及生态贡献等指标计算结果,考量研究区实际情况,研究区碳平衡分为3类:低碳优化区、碳总量控制区、碳汇功能区。由表7可知,低碳优化区包括A区,该地区碳排放风险在研究期内始终呈中高风险,且碳排放风险有继续增高趋势,但该地区由于经济发展水平较高,因此碳排放强度较低;该地区经济贡献系数始终处于较高水平,位于各区域前列,而生态承载系数始终处于较低水平。碳总量控制区包括B区、F区、M区、D区、I区、E区、J区、C区,该区域能源型城市较多,碳排放风险基本处于中、高风险水平,碳排放强度水平基本居研究区前列,经济贡献系数基本处于较低水平,表明该区域碳排放的经济效益较低;生态承载系数处于中等及较低水平。碳汇功能区包括N区、L区、G区、K区,该区域碳汇功能用地较多,如森林资源丰富,因此该区域碳排放风险在研究期基本呈中、低风险水平;碳排放强度因碳汇功能较高而处于较低水平,经济贡献系数也因碳吸收能力较好而处于中等偏上水平;该类区域生态承载系数较高。
表7 研究区土地利用碳平衡分区 |
| 碳平衡分区 | 碳排放要素特征 | 地区 | 区域特点 |
|---|---|---|---|
| 低碳优化区 | 碳排放风险呈高度风险及以上;碳排放强度小于0.50;经济贡献系数大于2.00;生态承载系数小于5.00 | A | 该地区碳排放总量较大,但碳排放强度较低,单位碳排放量的经济产出高于省内其他地区;尽管碳生态承载力较低,但经济基础好 |
| 碳总量控制区 | 碳排放风险基本呈中、高度风险;碳排放强度大于0.50;经济贡献系数小于2;生态承载系数小于10.00; | B、F、M、D、I、E、J、C | 该地区生态压力中等,地区生产总值不高,单位碳排放的经济效益相对较低 |
| 碳汇功能区 | 碳排放强度基本呈中、低度风险;碳排放强度小于1.00;经济贡献系数大于2.00;生态承载系数大于5.00 | N、L、G、K | 该地区林地面积大,固碳能力高,对保障全省的碳汇总量具有重要作用 |
3 讨论
本研究将研究区碳平衡分为低碳优化区、碳总量控制区和碳汇功能区。针对不同区域特点提出针对性碳减排策略。
3.1 土地利用低碳优化区减排策略
低碳优化区包括A区,尽管该区的土地利用碳排放量、碳排放风险较高,但其良好的经济基础和发达的重工业为土地低碳利用绿色转型提供了契机。因此,可依托其经济和技术实力,引导产业向高科技、新材料和清洁能源领域转型,强化服务业竞争力[7]。在确保自身经济增长的同时,凭借其影响力和经济辐射力,激发周边区域的经济与产业结构协同优化,从而增强碳排放效益的持久性。此外,可逐步拓展城市土地建设以促进工业化和城市化发展。在低碳优化区内,主要任务是强化工业品和服务产品的供应,鼓励生产要素聚集,适当增加重点发展区域对高端制造业和现代服务业的空间支持。发展过程中水资源、生活能源等资源消耗上升,对环境造成较大压力,因此,需科学规划居民居住区,适当增加绿地面积,开展城市绿地、公园建设,以提高城市的生态承载力。
3.2 土地利用碳总量控制区减排策略
碳总量控制区包括B区、F区、M区、D区、I区、E区、J区、C区。此类区域固碳能力相对较弱,经济发展优势不足。这些地区大多为能源密集型城市,面对高能耗带来的高碳排放问题,应加大科技创新投入,提高能源利用效率,推动产业向低碳、高效方向转型。碳总量控制区重点在于优化碳排放强度,提升经济效能。为此,应科学配置工业和居民用地,确保其与产业规划相协调,推动化石能源的高效再利用,避免生产过程中的资源损耗。同时大幅提升清洁能源的使用比例,推广低碳生产工艺,降低资源消耗、污染及碳排放强度。此外,发展循环经济理念,普及低碳技术,以降低二氧化碳的排放,且生活能源的循环利用也应得到重视。在追求经济增长的同时,城市中的碳汇资源也不容忽视,需坚决保护农田以及湿地、林地等生态环境用地。
3.3 土地利用碳汇功能区减排策略
碳汇功能区包括N区、L区、G区、K区。此类区域表现出较低的碳排放水平和风险,其碳汇潜力较大,生态环境承受的压力相对较小。此外,该区域森林资源丰富,是主要的林业基地;拥有优质的生态环境,有利于发展旅游业和高新技术产业,应重视维护碳汇资源,保护这些关键的碳汇区域,持续促进绿色产业可持续发展。碳汇功能区在水源保护、土壤稳定、防风固沙及生物多样性保护等生态服务中发挥重要作用。在确保经济持续发展的同时,应注重环境保护和修复工作。作为维持地区生态系统平衡的关键地带,严格管理建设用地面积的增长,提供生态服务。同时,应强化生态修复措施,保护并复原自然环境。充分利用当地独特的自然资源和地理优势,推动小规模、高附加值的特色产业发展,以实现经济、社会与生态的可持续共生。
4 结论
本研究综合分析了研究区的碳排放基尼系数、碳排放风险、碳排放强度、经济贡献系数及生态承载系数,并以此为分区指标对其进行碳平衡分区,提出不同区域差异化减排策略,主要结论如下。
(1)研究区的碳补偿率整体上处于低位,并且随时间的推移逐年下降,说明研究区碳汇总量无法完全满足其碳汇需求。2000—2023年基尼系数均超过0.60,处于不协调状态,研究区的碳补偿率存在较大的空间分异,并呈现出不断扩大的趋势。
(2)2000—2023年,各地区土地利用碳排放风险呈不同程度的增加,其中F区、G区和M区碳排放风险值增速较快,B区、C区和K区碳排放风险在2010—2023年有所下降。N区虽始终处于低度风险,但风险逐年升高。A区、D区、E区、I区和J区虽碳排放风险逐年升高,但在2010—2023年增速变缓,预测未来有降低的趋势。G区和M区碳排放风险逐年递增,未来仍有上升趋势。在2000年,各地区碳排放风险等级差异不明显,在2010年,空间差异较明显,在2020年和2023年,各地市空间差异十分明显,总体来看,2000—2023年各地市碳排放风险等级逐年升高,空间差异性逐渐明显。
(3)1980—2023年,研究区碳排放强度呈逐年下降趋势,其中1980—2000年间降速最快,2000—2005年有所回升,而后2005年开始平稳下降,维持在较低碳排放强度水平。总体来看,2000—2023年研究区各地区碳排放强度呈现不同程度的降低;N区和A区一直处于低碳排放强度水平,G区、D区、J区一直处于较高碳排放强度水平。2000—2023年,研究区各地区经济贡献值处于相对波动的状态。研究期间N区以及A区处于较高经济贡献水平,其余地区经济贡献水平均在较低水平。研究区生态承载系数呈现北部地区偏高,南部地区偏低的态势,整体呈偏低态势。
(4)研究区碳平衡分为低碳优化区、碳总量控制区和碳汇功能区。实施分类施策:低碳优化区依托经济与技术优势,推动产业绿色转型和服务业升级,通过经济辐射带动区域协同发展,同时优化城市空间布局提升生态承载力;碳总量控制区重点加强科技创新和能效提升,推进产业低碳化改造和清洁能源替代,优化土地利用结构,发展循环经济并严格保护生态空间;碳汇功能区则强化森林、湿地等核心碳汇区保护,严格控制开发强度,重点发展生态旅游、有机农业等环境友好型产业,同步推进生态修复工程。通过精准施策,构建经济发展与碳减排协同推进的区域可持续发展格局。